
Outdoor Enthusiasts' Classification of Animal Species and Estimation of Animal Life Expectancy
By Elizabeth Byrd (byrd12@purdue.edu) and Dr. Nicole Olynk Widmar (nwidmar@purdue.edu)
Published by the Center for Animal Welfare Science at Purdue University
RP.2015-06 | August 2015 © Purdue University
Executive Summary
Researchers in the Purdue University Department of Agricultural Economics conducted an online survey of outdoor enthusiasts in May 2014. They asked respondents about their outdoor activities, sentiments toward various animal species and the average life expectancy of animals (to the best of their knowledge). The researchers defined outdoor enthusiasts as those who self-identify as regularly participating in outdoor activities such as fishing, hunting or other outdoor activities (e.g., hiking or camping). Overall, respondents who regularly hunted more often classified rabbits, ducks, geese, deer and bison as livestock than non-hunters. Regular hunters also more frequently classified many animals as “game species.” Those who regularly hunted reported lower life expectancies for all species included in the survey compared to answers by non-hunters. These survey respondents also more often classified dogs, rather than cats, as “a member of the family”.
Keywords: animal classification, animal life expectancy
Introduction
Consumers, and more generally the U.S. public, are increasingly concerned about how their food is produced. This concern is evident in media stories, voting propositions and laws about food animal production processes such as hog production without gestation crates, egg production without battery cages, milk production without rBST and meat production without antibiotics or growth hormones.
Hunters are a unique subset of the public in the sense that they have a connectedness with their food. Aside from hunting the animals, they are also often involved in processing the animal into meat and other products. This is in contrast to farmers who often do not participate in the animal’s slaughter, but are closely involved with the animal’s rearing. Previous research has found that farmers may have significantly different perceptions of animal welfare and animal handling than consumers (Tonsor, Wolf, and McKendree, 2014).
It is conceivable that hunters have different sentiments toward animals and animal welfare than others who do not hunt. Six percent of U.S. residents (16 and older) participate in hunting. That represents 13.7 million Americans (U.S. Dept. of the Interior et. al, 2011). But, there are only 3.2 million farmers (USDA, 2014). Therefore, the population of hunters in the United States is much larger than that of farmers. Hunters spent 282 million days in the field and $33.7 billion on this pursuit (U.S. Dept. of the Interior et. al, 2011). The number of U.S. residents who hunted rose by 9 percent from 2006 to 2011 (U.S. Dept. of the Interior et. al, 2011). An interesting fact that distinguishes hunters even further from rural-resident farmers is that hunters who resided outside of a metropolitan statistical area (MSA) accounted for only 20 percent of the group (U.S. Dept. of the Interior et. al, 2011). Thus, the majority of hunters live within an MSA.
The research team hypothesized that hunters would classify animals differently than non-hunters. This paper explores how the classification of animals and estimation of animal life expectancy differs by outdoor enthusiasts who hunt versus those who do not.
Research Methods and Data
Survey Instrument
Researchers administered an online survey in May 2014 to 872 respondents who regularly participated in an outdoor activity such as hunting, fishing, hiking or camping. The survey collected information about participation in outdoor activities and views on different animal species.
The Purdue research team used Qualtrics to administer the survey and Global Market Insite (GMI) to supply the panel of potential respondents. GMI distributed the survey to potential respondents, as well. The participants were approximately representative of the U.S. population based on the most recent census for gender, age, income, and region of residence. Respondents had to be at least 18 years old and regularly participate in fishing, hunting or another outdoor activity such as hiking or camping. They were permitted to select more than one outdoor activity.
Sample Summary Statistics and Demographics
Table 1 shows the demographics of survey respondents. The average age was 47, and half of the group was male. Researchers converted household income to a continuous variable and then calculated the mean to be $59,495. This is above the median U.S. household income of $53,046 (U.S. Census Bureau, 2014). In this sample, 99 percent of respondents had graduated high school, and 42 percent had earned a bachelor’s degree or more. On average, 86 percent of Americans 25 or older have graduated high school, and 29 percent have a bachelor’s degree or higher (U.S. Census Bureau, 2014). The mean household size of this sample is 2.62 people. According to the most recent census, the U.S. average household size is 2.61 people (U.S. Census Bureau, 2014). On average, respondents spent $219.22 per week on food with 80 percent on food consumed at home.
| Variable Description | Survey Frequency (%) |
|---|---|
| Mean Age | 47 |
| Male | 50% |
| Education | |
| Did not graduate from high school | 1% |
| Graduated from high school, did not attend college | 21% |
| Attended college, no degree earned | 21% |
| Attended college, associate or trade degree earned | 14% |
| Attended college, bachelor’s degree earned | 29% |
| Attended college, advanced (MS, Ph.D., law school) degree earned | 14% |
| Annual Household Pretax Income | |
| Less than $20,000 | 14% |
| $20,000-$39,999 | 22% |
| $40,000-$59,999 | 21% |
| $60,000-$79,999 | 17% |
| $80,000-$99,999 | 10% |
| $100,000-$119,999 | 6% |
| $120,000 or more | 11% |
| Region of Residence | |
| Northeast | 17% |
| South | 33% |
| Midwest | 26% |
| West | 24% |
| Outdoor Activities | |
| Regularly participated in fishing | 63% |
| Regularly participated in hunting | 27% |
| Regularly participated in other activities | 79% |
| Had ever hunted | 52% |
| Had ever fished | 94% |
| Pet Ownership | |
| Owned at least one dog | 54% |
| Owned at least one cat | 46% |
| Owned at pet (cat or dog) | 70% |
| Vegetarian | 6% |
| Vegan | 4% |
| Attitude toward reasons people hunt | |
| Agree with hunting to obtain food | 93% |
| Agree with trophy hunting | 33% |
| Agree with wildlife population control | 80% |
| Agree with sporting/recreation activity | 54% |
Results and Discussion
Outdoor Enthusiasts’ Classification of Animal Species
The survey asked respondents to classify dogs and cats as animals, family members, working animals, children or pets. Overall, 55 percent of respondents classified dogs as a family member, 26 percent as a pet and 14 percent as an animal. They categorized the remainder as either a working animal or child. Likewise, 47 percent indicated cats were a member of the family. Thirty-two percent saw them as a pet, 19 percent as an animal and the remainder as either as a working animal or child.
When comparing those who indicated that they regularly hunt (hunters) to non-hunters (indicated they do not regularly hunt), slightly more hunters saw dogs as a member of the family. Twenty-eight percent of non-hunters and 21 percent of hunters responded that dogs were pets. Figure 1 shows the results of this question.
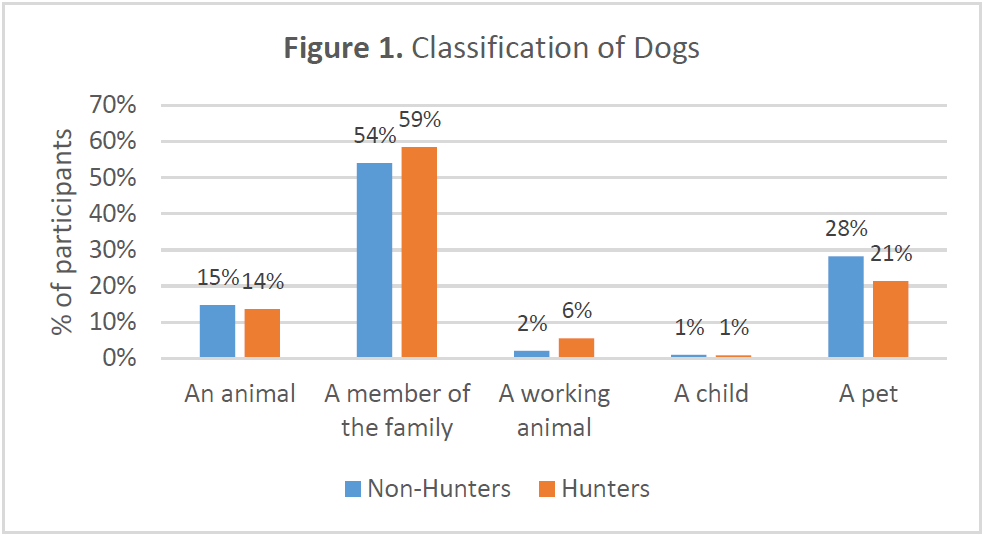
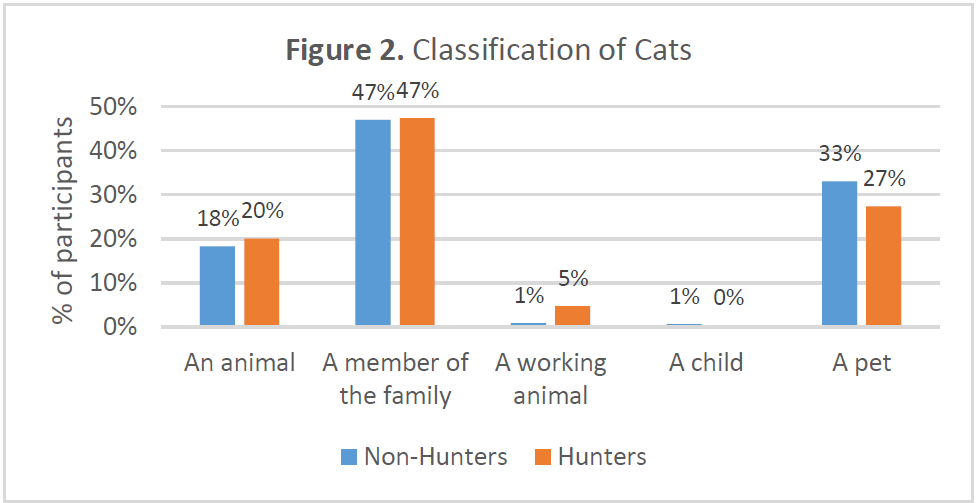
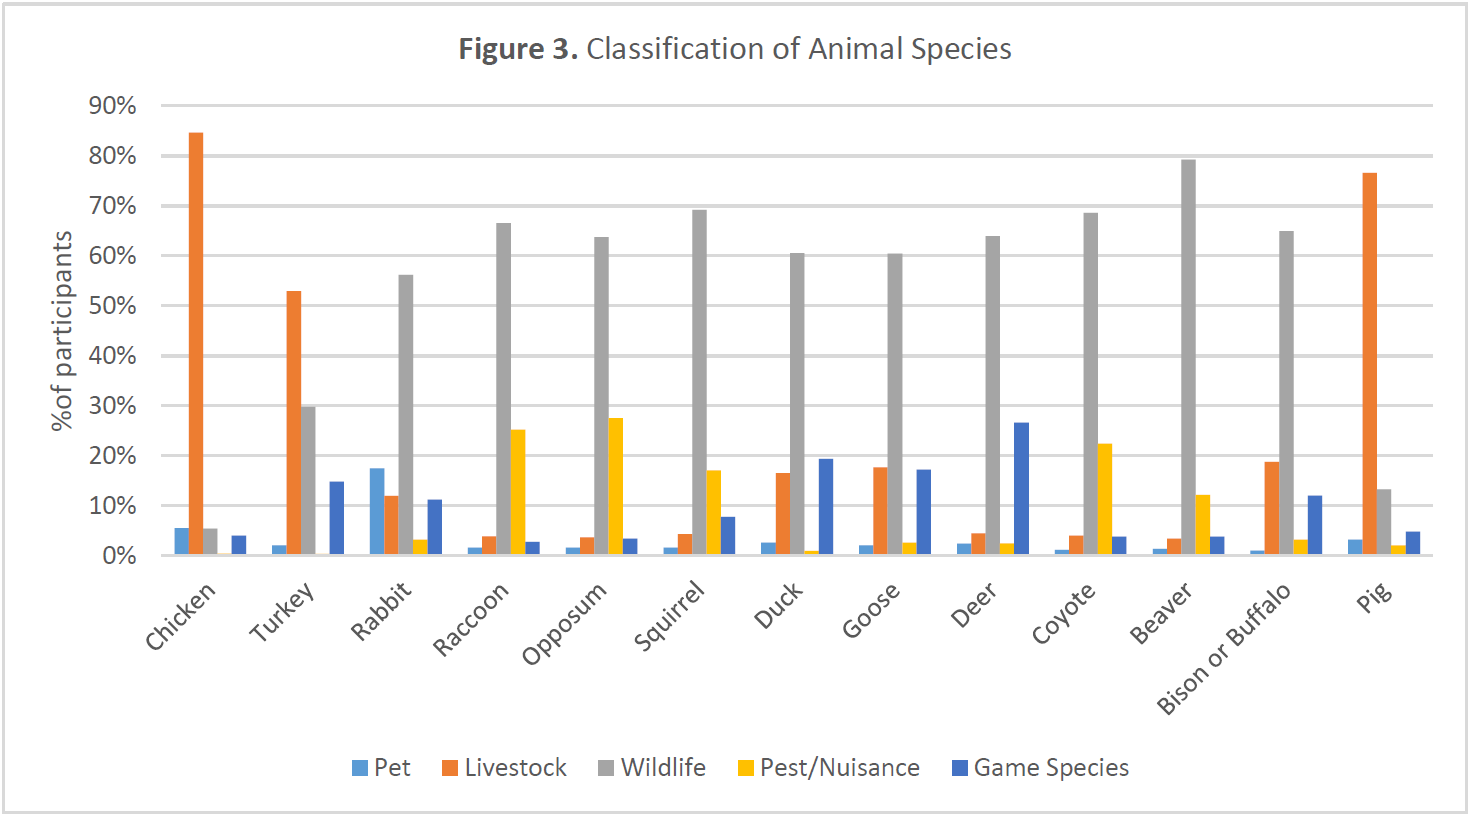
Figure 2 illustrates the classification of cats by hunters and non-hunters. An equal percentage, 47 percent, indicated that cats were a members of the family. A higher percentage of non-hunters classified cats as pets. A slightly higher percentage of hunters, 20 percent, saw cats as animals. In addition to cats and dogs, the survey asked participants to classify a variety of animals as pets, livestock, wildlife, pest/nuisance or a game species. Figure 3 shows the results. The majority of people, 85 percent, classified a chicken as livestock. Fifty-three percent of respondents saw a turkey as livestock, while 30 percent saw it as wildlife. Most rabbits were classified as either wildlife, 56 percent, or pets, 17 percent. Raccoons and opossums were mainly classified as wildlife, 67 percent and 64 percent, respectively. Yet, some people saw them as pests, 25 percent and 28 percent, respectively. Squirrels fell into the wildlife category for 69 percent of respondents. Sixty-one percent of survey participants classified ducks as wildlife, 17 percent as livestock and 19 percent as a game species. Similarly, 60 percent of respondents described geese as wildlife, 18 percent as livestock and 17 percent as a game species. For deer, 64 percent of respondents classified them as wildlife and 27 percent saw them as a game species. Coyotes were either wildlife, 69 percent, or pests, 22 percent. Most participants, 79 percent, saw beavers as wildlife. When it came to bison, 65 percent of respondents classified them as wildlife and 19 percent as livestock. Finally, 77 percent of participants indicated that pigs were livestock, while 13 percent saw them as wildlife.
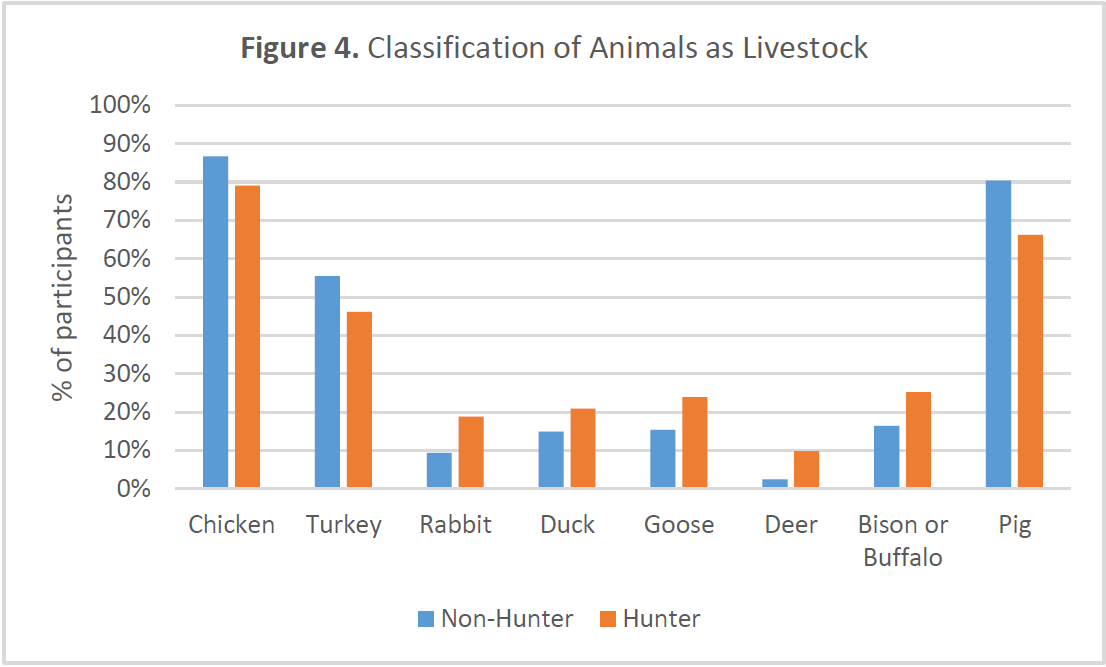
The researchers broke down the animal classification further by separating respondents into hunters versus non-hunters. Figure 4 shows which animal species hunters and non-hunters categorized as livestock. Regular hunters less often classified chickens, turkeys and pigs as livestock than those who did not hunt. However, those who regularly hunted more often classified rabbits, ducks, geese, deer and bison as livestock, potentially indicating hunters may be more familiar with the formal production of these species than non-hunters.
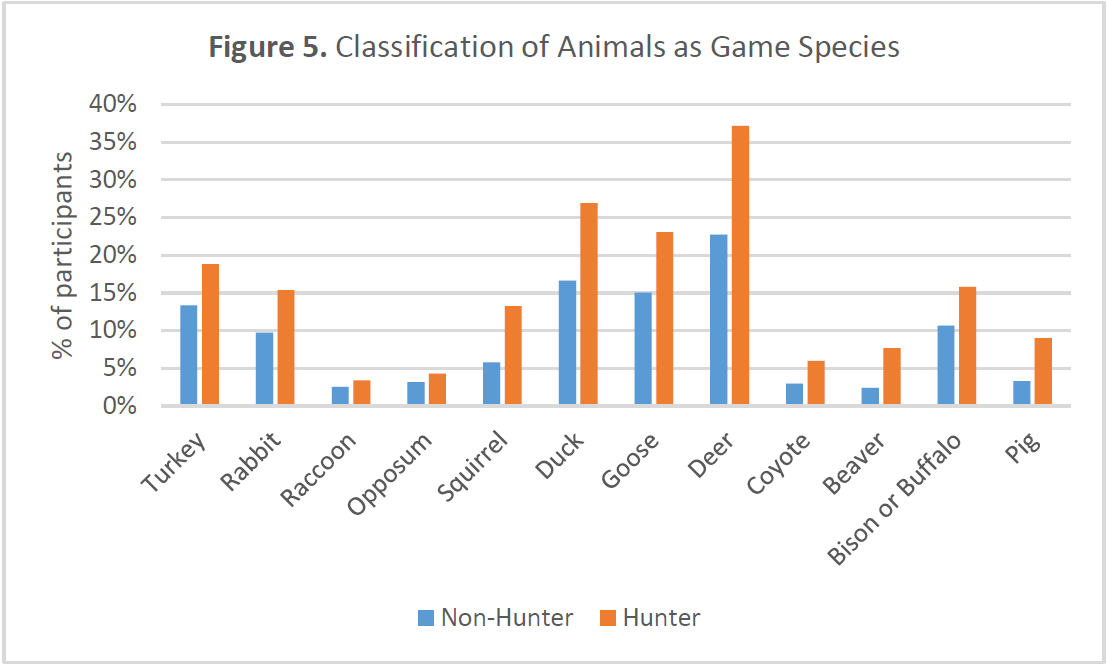
Hunters and non-hunters also classified species as game at different rates as shown in Figure 5. Hunters more often described all species, except chickens, as game. Specifically, 37 percent of hunters and only 23 percent of non-hunters classified deer as game. Hunters were also more often categorized turkeys, squirrels, ducks, geese and pigs as game. This is logical because hunters are likely more familiar with the species that are typically used as prey.
Outdoor Enthusiasts’ Estimates of Animal Life Expectancy
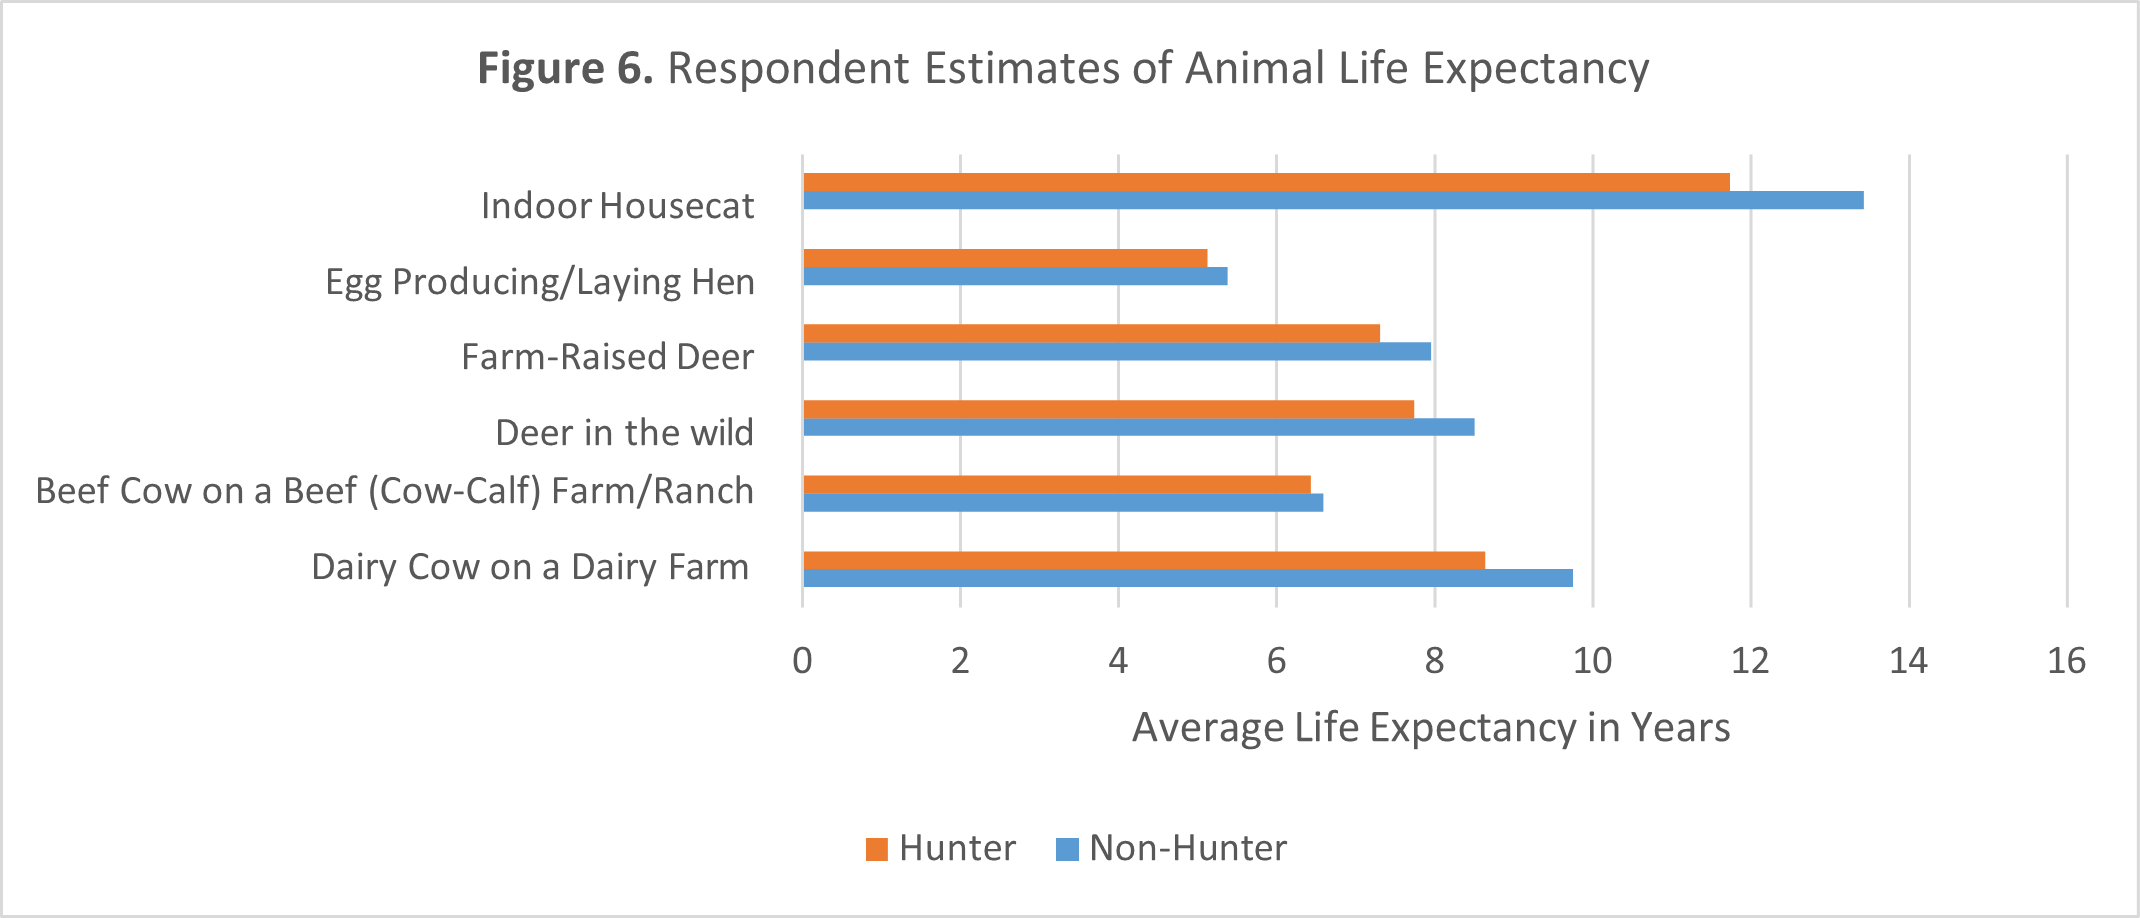
Respondents also estimated the average life expectancy (in years) of both wild and domestic animal species. On average, respondents estimated the average life expectancy of a dairy cow to be 9.5 years, a beef cow to be 6.6 years, a wild deer to be 8.3 years, a farm-raised deer to be 7.8 years, an egg-producing hen to be 5.3 years and an indoor cat to be 13 years.
Dairy cows will average two and a half lactations in intensive management systems (EPA, 2012a), making their life expectancy approximately four to five years. Thus, respondents doubled the life expectancy of a dairy cow. Survey respondents were close to the life expectancy of a beef cow, perhaps even understating her life expectancy. A beef cow will remain in a breeding herd for seven to nine years on average (EPA, 2012b). On the other hand, respondents overestimated the life expectancy of a deer in the wild by as much as four times. A white-tailed deer generally lives two to three years in the wild and 16 years in captivity (Dewey, 2003). Indoor cats can live about 13 to 17 years (ASPCA, 2015). Thus, respondents were on the low end when estimating the life expectancy of an indoor cat.
Figure 6 shows respondents’ estimates of animal life expectancy broken down by whether they regularly hunted or not. For each animal, hunters estimated the average life expectancy to be lower than non-hunters. In the case of the indoor cat, hunters estimated the life expectancy to be 1.7 years lower than non-hunters.
Conclusions and Implications
The general public in the United States is increasingly concerned about the welfare of various animal species. Hunters are a unique segment of U.S. residents who have a much different relationship to animals than the public, meat consumers or even farmers. Thus, it is useful to understand how hunters classify animals and estimate animal life expectancy. The Purdue research team accomplished this by collecting and analyzing data from 872 outdoor enthusiasts.
Twenty-seven percent of respondents reported regularly participating in hunting. When asked to classify dogs and cats, some differences emerged. A higher percentage of hunters classified dogs as “a member of the family” than non-hunters. While hunters and non-hunters classified cats as “a member of the family” at the same rate, hunters more often classified cats as “an animal” and non-hunters more frequently classified cats as “a pet.”
Researchers also asked respondents to classify a variety of domestic and wild animals. The majority of respondents classified chickens, turkeys and pigs as livestock. Likewise, most participants saw rabbits, raccoons, opossums, squirrels, ducks, geese, deer, coyotes, beavers and bison as wildlife. When looking at how hunters versus non-hunters classified animals as livestock, non-hunters indicated that chickens, turkeys and pigs were livestock more often than hunters did. However, hunters more often classified rabbits, ducks, geese, deer and bison as livestock. Hunters also more often categorized animal species as “game species.”
The survey also asked respondents to estimate the average life expectancy of wild and domestic animals. Hunters had lower average life expectancy estimates for all species queried than non-hunters. Generally, respondents overstated the life expectancy for a dairy cow and deer in the wild; however, their estimates were generally on par for beef cattle and indoor cats.
Hunters classified animals and estimated life expectancies differently than non-hunters. Thus, a person’s experience with animals, such as hunting, may help explain the variations in concern for animal welfare or the disparities in the willingness to pay for animal welfare attributes in food animals.
References
- ASPCA. 2015. “General Cat Care” Available at: https://www.aspca.org/pet-care/cat-care/general-cat-care
- Dewey, T. 2003. "Odocoileus virginianus" (On-line), Animal Diversity Web. Accessed March 28, 2015 at http://www.biokids.umich.edu/accounts/Odocoileus_virginianus/
- EPA. 2012a. “Lifecycle Production Phases” Available at: http://www.epa.gov/agriculture/ag101/dairyphases.html
- EPA. 2012b. “Production Phases” Available at: http://www.epa.gov/agriculture/ag101/beefphases.html
- Tonsor, G., Wolf, C., & McKendree, M., 2014. Research Illuminates Need for More Beef Production Awareness. Beef Magazine. http://beefmagazine.com/animal-welfare/research-illuminates-need-more-beef-production-awareness
- U.S. Census Bureau. 2014. State and Country Quick Facts. Available at http://quickfacts.census.gov/qfd/states/00000.html
- U.S. Department of the Interior, U.S. Fish and Wildlife Service, and U.S. Department of Commerce, U.S. Census Bureau. 2011. National Survey of Fishing, Hunting, and Wildlife-Associated Recreation.
- USDA, 2014. 2012 Census of Agriculture Highlights: Farm Demographics. Available at http://www.agcensus.usda.gov/Publications/2012/Online_Resources/Highlights/Farm_Demographics/Highlights_Farm_Demographics.pdf