
Exploring Demand for Attributes of Processed Turkey Products: Turkey Bacon and Lunchmeat
Courtney L. Bir*1, Nicole J. Olynk Widmar†, Melissa K. Davis‡, Marisa A. Erasmus‡, and Stacy M.S. Zuelly‡
*Oklahoma State University, Department of Agricultural Economics
†Purdue University, Department of Agricultural Economics
‡Purdue University, Department of Animal Science
Abstract
Health consciousness and changing tastes/preferences have driven consumers’ interests in poultry-based meat products, such as turkey bacon. Simultaneously, turkey producers and processors are facing changing consumer preferences for credence attributes of turkey rearing, including whether turkeys were raised free range or on a vegetarian diet. Consumption of turkey bacon and turkey lunchmeat, were studied using a national sample of 1,130 U.S. respondents. Ninety-five percent of respondents consumed poultry; 40% indicated they consumed it 2 – 3 times per week. Forty-eight percent of respondents indicated that they ate lunch outside the home once or twice a week. Respondents were randomly assigned to participate in the choice experiment for either turkey bacon or turkey lunchmeat. Consumer WTP for attributes of turkey bacon (n=559) and turkey lunchmeat (n=571) were assessed using discrete choice experiments. The mean estimated willingness to pay was positive for all verified attributes of turkey bacon, for all but retailer-certified free range and retailer-certified fed a vegetarian diet for turkey lunchmeat. There were some statistical differences in willingness to pay for verified attributes between the two processed turkey products, suggesting demand for production attributes varies between processed turkey products. Turkey producers and processors should consider the particular products consumers are interested in and/or buying, as there is at least some evidence that demand for attributes of production systems varied between the products studied. Further analysis is necessary to determine if tastes and preferences of consumers vary across other key turkey or poultry products.
Introduction
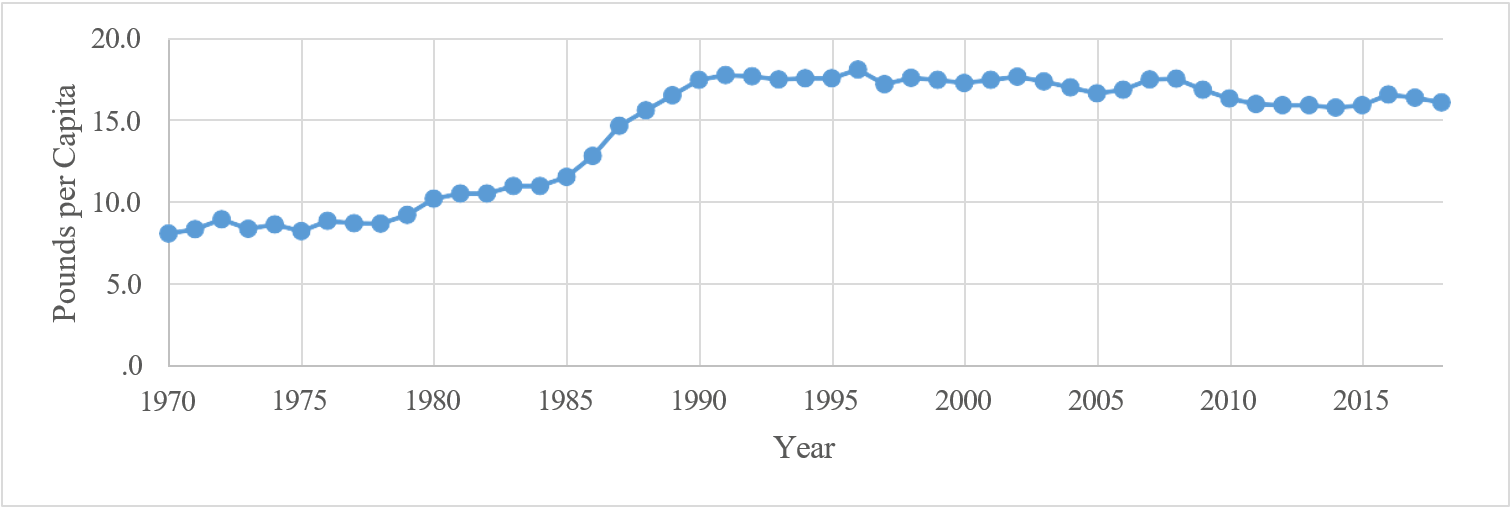
Given the reported rise of interest in lean protein among millennials (Daniels, 2016), it may not be surprising that poultry has been a focus in recent years with regard to development of unique and varied products. According to Jones, Haley, and Melton (2018), “Rising meat demand in the U.S. has been supported by sustained economic growth since the 2009 Great Recession and stable to declining retail prices brought about by low animal feed costs.” Increasingly, turkey has undergone growth in total pounds per capita of commercial disappearance, in particular during the 1980s when it climbed to its currently sustained increased levels (Figure 1, developed using USDA ERS, 2019 data download). Popular press has focused on turkey products, mentioning the popularity of turkey sausage and bacon, specifically, and citing turkey bacon as experiencing particularly strong retail growth per reporting by Jennie-O via Hormel (Daniels, 2016).
Figure 1. Per capita disappearance (pounds) using retail weight as reported by WASDE
Lunchmeat is a rather unique meat product in the sense that it is bought cooked and cold, and generally consumed without further preparation or reheating. McKendree and Widmar (2013) sought to measure volume of consumption by households in their national sample of 798 respondents, finding that 88% of respondents were in lunchmeat consuming households. Of the households found to consume lunchmeat, 37% consumed less than ½ a pound per week, 40% consumed 8 oz to 16 oz per week, 14% consumed 1.1 to 2 lbs per week, and 7% (47 households) consumed over 2 lbs per week. Turkey has been identified as the most commonly purchased or consumed lunchmeat variety amongst lunchmeat consuming households (Mintel, 2012; McKendree & Widmar, 2013).
Consumers’ affinity for bacon has been widely recognized with headlines like “Why bacon is suddenly everywhere” in Fortune (Hackett, 2015) and “Record bacon prices driving retail pork prices” on National Hog Farmer (Plain, 2017) fueling the public conversations around bacon broadly. While there has been work done to study demand for bacon attributes (Bir et al., 2018), there is a relative dearth of information related to consumer demand for and perceptions of turkey bacon. Turkey bacon undergoes a different process to form bacon prepared from chopped, formed, cured, and smoked turkey, which differs from the traditional bacon made with fattier pork bellies. “Based on how it's made, turkey bacon is more like sausage than pork bacon,” according to Jeffrey Sindelar, a meat specialist at the University of Wisconsin–Madison's Meat Laboratory. There are two main styles: one that's made from finely ground meat and one that's made from meat chopped into larger chunks.” (Shannon, 2018). Turkey bacon is often marketed as a lower fat/calorie bacon alternative, although many of the same concerns about preservatives, nitrates, and other processing techniques/ingredients remain (Julson, 2018).
This analysis seeks to investigate consumer preferences surrounding two popular processed turkey products, specifically turkey lunchmeat and turkey bacon. Turkey lunchmeat and turkey bacon were selected for their similarities (i.e., both processed products made from turkey) and differences (i.e., eating occasion, when and how they are generally consumed). Turkey lunchmeat is generally consumed cold, in the same form in which it was purchased. Oftentimes lunchmeat, as per its name, is consumed as an on-the-go meal or brown-bag lunch item. In contrast, turkey bacon is generally consumed hot/warm, often as part of breakfast, although increasingly at other meals as a salad topping, sandwich enhancement, or even a snack. The objective of this analysis was to determine consumer WTP for turkey bacon and turkey lunchmeat production process attributes. Specifically, this analysis sought to 1) evaluate consumer shopping behavior and preferences especially regarding lunchmeat 2) compare consumer WTP between production attributes and verifiers within the products turkey bacon and turkey lunchmeat, and 3) compare consumer WTP for production attributes between turkey lunchmeat and turkey bacon. The production attributes of interest are free range, fed a vegetarian diet, hormone use, and antibiotic use. Because all of these production attributes are credence attributes that cannot be confirmed by the consumer, even after consumption, these attributes were stated to be certified by either the USDA Process Verified Program (PVP), the turkey industry, or a retailer. It was hypothesized that the consumers’ WTP would vary across turkey products for the same verified attributes, as well as across verified production process attributes within each turkey product.
Materials and Methods
A survey was developed by an interdisciplinary team of researchers familiar with consumer behavior, meat science, and turkey production to elicit consumer demand for turkey lunchmeat and turkey bacon. The survey instrument was administered November 12-19, 2018 using the online survey tool Qualtrics to accumulate demographic information, food purchasing and consumption behavior, and WTP for turkey bacon and turkey lunchmeat. Online surveys have become increasingly popular and favored due to their ow costs and relatively fast completion times (Louviere et al., 2008; Tonsor & Wolf, 2010; Olynk & Ortega, 2013). Due to the rapid adoption of online surveys for data collection, in particular with respect to consumer surveys, a field of research on the survey administration mechanism has swarmed to study online surveys relative to traditional methods. Hudson et al. (2004) documented that internet surveys did not exhibit nonresponse bias and Fleming and Bowden (2009) and Marta-Pedroso, Freitas and Domingos (2007) found no significant differences when comparing results of web-based surveys, conventional mail and in-person interview surveys.
The company, Lightspeed GMI, hosts a large opt-in panel database which was used to obtain survey respondents. Respondents were required to be 18 years of age or older to participate. The sample was targeted to be representative of the U.S. population in terms of gender, income, education, and geographical region of residence (U.S. Census Bureau, 2016) using quotas in Qualtrics. Regions of residence were defined as in the Census Bureau Regions and Divisions (U.S. Census Bureau, 2016). The survey instrument was designed to collect information regarding shopping behavior, food consumption and dining preferences, with a special highlight on lunchmeat consumption as well as turkey bacon and turkey lunchmeat WTP. The statistical representativeness of the survey respondents was evaluated using the test of proportions to compare the percentages of demographic groups from the sample with the targeted population, the U.S. Census.
Respondents were asked shopping behavior questions such as: if they were the primary shopper, online shopping behavior, and total money spent on food consumption. To gauge meat consumption, respondents were asked about meat consumption within their households, with a special emphasis on poultry and lunchmeat consumption. Since WTP for turkey bacon was specifically considered in the survey instrument, respondents were also asked about their preferences for nitrite and nitrate in foods, given its use in processed meats and significant controversy in popular press. Respondents were asked about the number of meals eaten out for breakfast, lunch and dinner as well as the number of times they consumed snacks and drinks outside the home.
WTP model for turkey bacon and turkey lunchmeat
Five-hundred and fifty-nine random respondents participated in a WTP choice experiment focusing on turkey bacon, and 571 random respondents participated in a WTP choice experiment focusing on turkey lunchmeat for a total of 1,130 respondents in the studied sample. 1 Respondents participated in either a WTP experiment where they were asked to choose between two turkey bacon purchasing scenarios or two turkey lunchmeat purchasing scenarios or the option “I do not choose to purchase either option A or B”. For both products studied, respondents were informed that they could face this decision in a retail store where they typically shop. Additionally, respondents were informed that the two turkey bacon products or two turkey lunchmeat products presented in each scenario had the same characteristics in terms of color, brand, and flavor, with the exception of the varying attributes presented. Information explaining each of the five attributes in the choice experiment (available in Appendix A) was shown to respondents prior to presenting any choice questions. Attributes included were the same for both products with the exception of price: free range (yes, no), fed a vegetarian diet (yes, no), hormone use (not permitted, permitted), antibiotic use (not permitted, permitted), and certifier (USDA, industry, retailer). There were three price levels for both products, $1.69, $3.65, and $5.61 per 12 oz package of turkey bacon, and $2.99, $5.99, and $8.99 per 16 oz package of turkey lunchmeat. To minimize hypothetical bias, respondents were also shown the cheap talk script as proposed by Lusk (2003).
The specific combination of attribute levels seen by respondents in the choice experiment was determined using the SAS OPTEX program, which resulted in a main effect plus two-way interaction experimental design (Lusk & Norwood 2005). Maximizing D-efficiency was used as the measure for design choice. The D-efficiency for the chosen model for both turkey bacon and lunchmeat was 75.3486 and included 33 choice scenarios (questions) for each product. To avoid survey fatigue, which has been shown to decrease the quality of responses (Galesic & Bosnjak, 2009), the 33 choice scenarios for each product were randomly assigned to 3 blocks of 8 choice scenarios, and 1 block of 9 choice scenarios, for a total of 4 blocks for each product. Respondents were then randomly assigned to participate in one of the four WTP blocks for each product, for a total of eight WTP blocks in total when considering both products.
Random utility theory is the basis for choice experiments. The probability that alternative i was chosen by respondent n, which represents maximizing utility (U) with deterministic component Vnit, if Unit > Unjt ∀ j≠i is represented by (Train, 2009):
P sub n-i-t equals the probability that V sub n-i-t plus epsilon sub n-i-t is greater than V sub n-j-t plus epsilon sub n-j-t, for all j in set C where j is not equal to i.
Equation (1) can be condensed through algebraic manipulation given the underlying distribution of the error term to:
P sub n-i-t equals the exponential of V sub n-i-t divided by the sum over j of the exponential of V sub n-j-t.
The random utility of a selection for either product is defined as:
V sub i-t equals beta one times Price sub i-t, plus beta two times USDA Veg Diet sub i-t, plus beta three times Retailer Veg Diet sub i-t, plus beta four times Industry Veg Diet sub i-t, plus beta five times USDA Hormone Use sub i-t, plus beta six times Retailer Hormone Use sub i-t, plus beta seven times Industry Hormone Use sub i-t, plus beta eight times USDA Free Range sub i-t, plus beta nine times Retailer Free Range sub i-t, plus beta ten times Industry Free Range sub i-t, plus beta eleven times USDA Antibiotic Use sub i-t, plus beta twelve times Retailer Antibiotic Use sub i-t, plus beta thirteen times Industry Antibiotic Use sub i-t, plus beta fourteen times Opt Out sub i-t, plus beta fifteen times Opt Out Buy Turkey sub i-t, plus beta sixteen times Opt Out Age sub i-t.
where Price is the price a consumer is willing to pay for turkey bacon and turkey lunchmeat, and Optout is a constant which represents the respondent’s disutility from having to walk away from the purchase of turkey bacon or turkey lunchmeat, Optout_Buysturkey and Optout_Age are the interaction between the disutility of having to walk away from a turkey bacon or turkey lunchmeat purchase, whether the respondent had purchased turkey products in the past, and the age of the respondent, USDA_VegDiet, Retailer_VegDiet, and Industry_ VegDiet are the effects coded interaction terms between the certification entities and VegDiet (where VegDiet indicates the animal was fed a vegetarian diet), USDA_HormoneUse, Retailer_HormoneUse, and Industry_HormoneUse are the effects coded interaction terms between the certification entities and HormoneUse (where HormoneUse indicates hormone use was not permitted), USDA_FreeRange, Retailer_FreeRange, and Industry_FreeRange are the effects coded interaction terms between the certification entities and FreeRange (where FreeRange indicates the animal was free range), and USDA_AntibioticUse, Retailer_AntibioticUse, and Industry_AntibioticUse are the effects coded interaction terms between the certification entities and AntibioticUse (where AntibioticUse indicates antibiotic use was not permitted). WTP is calculated by dividing the marginal utility of an attribute by the marginal utility of the cost, for example the WTP for USDA verified animals fed a vegetarian diet turkey bacon or turkey lunchmeat can be calculated as:
W T P equals negative two times beta sub two divided by beta sub one.
The -2 in Equation 4 accounts for the effects coding of the various levels of the attributes. The disutility in terms of dollars of walking away from the purchase of turkey bacon or turkey lunchmeat (OptOut) for a person aged 18-24 who purchased turkey products in the past is calculated as:
W T P equals negative open parenthesis beta fourteen plus beta fifteen plus beta sixteen times one close parenthesis, divided by beta one.
Ninety-five percent confidence intervals were calculated to account for the variability in the estimations using the Krinsky and Robb method of parametric bootstrapping (Krinsky & Robb 1986; Olynk & Ortega 2013). Overlapping confidence intervals were compared to determine statistically significant differences between respondent willingness to pay for the different attributes within each model, either turkey lunchmeat or turkey bacon (Schenker and Gentleman, 2001). The complete combinatorial method as outlined by Poe, Giraud, and Loomis (2005) was used to statistically compare WTP estimates between the turkey bacon and turkey lunchmeat models.
1 The respondents randomly selected to answer these questions were part of a larger data collection that resulted in 1,695 responses.
Results
Statistical differences between the full sample, those who participated in the turkey bacon WTP experiment, those who participated in the turkey lunchmeat WTP experiment and the U.S. Census were analyzed (Table 1). There were statistical differences between the U.S. Census and the full sample at the <0.001 level, the turkey bacon WTP respondents, and the turkey lunchmeat WTP respondents. For the turkey bacon and turkey lunchmeat respondents, there were lower percentages of those aged 18-24, those with an income higher than $100,000, those that did not graduate from high school, and those from the Midwest when compared to the U.S Census. Higher percentages of respondents did not graduate from high school and were from the South for the two sub-samples when compared to the U.S. Census. There were higher percentages of respondents in the full sample and WTP for turkey bacon sample when compared to the U.S census who attended college Associates or Bachelor’s degree earned. There was also a lower percentage of respondents in the full sample who graduated from high school, did not attend college and a higher percentage of respondents who attended college no degree earned when compared to the U.S. Census.
| Demographic Variable | Total Percentage of Respondents n=1130 | WTP turkey bacon experiment n=559 | WTP turkey lunchmeat experiment n=571 | U.S. Census |
|---|---|---|---|---|
| Gender | ||||
| Male | 45* | 46 | 45 | 49 |
| Age | ||||
| 18-24 | 8** | 7** | 8** | 13 |
| 25-34 | 17 | 19 | 16 | 18 |
| 35-44 | 18* | 18 | 18 | 16 |
| 45-54 | 18 | 17 | 19 | 17 |
| 55-65 | 18 | 17 | 19 | 17 |
| 65+ | 21 | 22 | 20 | 19 |
| Income | ||||
| $0-$24,999 | 25* | 25* | 25* | 22 |
| $25,000-$49,999 | 24 | 23 | 25 | 23 |
| $50,000-$74,999 | 19 | 19 | 19 | 17 |
| $75,000-$99,999 | 13 | 15* | 12 | 12 |
| $100,000 and higher | 19** | 18** | 19** | 26 |
| Education | ||||
| Did not graduate from high school | 4** | 3** | 3** | 13 |
| Graduated from high school, Did not attend college | 23** | 23* | 24* | 28 |
| Attended College, No Degree earned | 25** | 24 | 26* | 21 |
| Attended College, Associates or Bachelor's Degree earned | 34** | 36** | 32* | 27 |
| Attended College, Graduate or Professional Degree earned | 14* | 14 | 15* | 12 |
| Region | ||||
| Northeast | 19 | 19 | 19 | 18 |
| South | 35** | 35** | 36** | 21 |
| Midwest | 22** | 22** | 22** | 38 |
| West | 23 | 24 | 23 | 24 |
*Percentage of respondents is statistically different than the percentage of the US census at the <.05 level;
**Percentage of respondents is statistically different than the US census at the <.001 level
Eighty seven percent of respondents were the primary shopper for their household. Eighty percent of respondents indicated they food shopped at least weekly. Twenty-four percent of respondents reported that they shopped online, which was defined as either/or online with delivery, online with curbside pick-up, and online with in-store pick up. Of the respondents that shopped online with delivery (n=187), 77% had used Amazon (including Amazon Prime), 41% had used Amazon Prime Pantry, and 39% had used a different online grocery provider. On average respondents spent $127 dollars per week on total food consumption including at home, on groceries, in restaurants, take-outs etc.
Respondents were also posed questions regarding their particular food consumption habits. Between 60% and 71% of respondents indicated they at least sometimes purchased organic fruit, vegetables, chicken and beef. Between 47% and 55% of respondents indicated they at least sometimes purchased organic turkey, dry-goods and cereals, dairy products, and non-dairy beverages (Table 2). Ninety-five percent of respondents consumed meat, 2% did not consume meat but someone in their household did, and 3% of respondents did not consume meat and no one in their household did. Regarding poultry specifically, 95% of respondents consumed poultry, with 40% of respondents indicating they consumed poultry 2-3 times a week. Thirteen percent of respondents raised or hunted for a portion of the meat they consumed, while 7% of respondents raised or hunted for turkey specifically. Thirty-four percent of respondents indicated they actively avoided products with nitrite or nitrate added, 37% indicted they do not, and 29% indicated they don’t know (Table 2). In general, higher percentages of respondents consumed lunchmeat in the fall (Table 2).
Respondents selected the frequency of meals (breakfast, lunch, dinner) eaten out, for example either take out, restaurant, or cafeteria settings, from the options: zero meals, 1-2 meals, 3-4 meals, 5-6 meals, and all 7 meals (Table 2). High percentages of respondents (58%) indicated that they did not eat breakfast out. Thirty-two percent of respondents ate 1-2 breakfast meals out. A high percentage of respondents (48%) eat 1-2 lunch meals outside the home, while 32% eat zero lunch meals out in a given week. Fifty-four percent of respondents eat 1-2 dinners out, and 28% of respondents eat zero dinner meals out. Less than 3% of respondents eat all 7 meals out for breakfast, lunch or dinner.
| Respondent organic food purchasing behavior, percentage of respondents n=1130 | |||||
|---|---|---|---|---|---|
| Food | Yes, regularly | Yes, sometimes | No | I don't know | |
| Fruits | 34 | 36 | 28 | 2 | |
| Vegetables | 35 | 36 | 27 | 2 | |
| Chicken | 35 | 36 | 27 | 2 | |
| Beef | 30 | 30 | 38 | 2 | |
| Turkey | 23 | 32 | 42 | 3 | |
| Dry-goods and cereals | 14 | 33 | 49 | 3 | |
| Dairy products, including fluid milk | 25 | 30 | 42 | 2 | |
| Non-dairy beverages | 21 | 26 | 50 | 3 | |
| Consumer preferences for nitrate and nitrate added products, percentage of respondents n=1130 | |||||
| Preference | Yes | No | I don't know | ||
| Actively avoids products with nitrite or nitrate added | 34 | 37 | 29 | ||
| Respondent lunchmeat consumption, percentage of respondents n=1099 | |||||
| Lunchmeat | Spring | Summer | Fall | Winter | Never |
| Ham | 56 | 57 | 61 | 60 | 18 |
| Turkey | 48 | 52 | 70 | 59 | 15 |
| Roast Beef | 48 | 53 | 54 | 52 | 27 |
| Chicken | 67 | 72 | 64 | 62 | 20 |
| Number of meals eaten out (either take out, restaurant, or cafeteria setting), percentage of respondents n=1130 | |||||
| Meal | Zero meals eaten out | 1-2 meals | 3-4 meals | 5-6 meals | All 7 meals |
| Of the 7 breakfasts in a given week | 58 | 32 | 5 | 3 | 2 |
| Of the 7 lunches in a given week | 32 | 48 | 13 | 5 | 2 |
| Of the 7 dinners in a given week | 28 | 54 | 12 | 4 | 3 |
| Number of times in a typical week respondents purchase the following items outside the home, percentage of respondents n=1130 | |||||
| Item | Never | 1-2 times | 3-4 times | 5-6 times | 7 or more |
| Coffee or tea | 35 | 41 | 13 | 5 | 7 |
| Juice/smoothies | 62 | 29 | 6 | 2 | 2 |
| Dairy beverages | 53 | 36 | 6 | 3 | 2 |
| Snack | 29 | 49 | 13 | 6 | 3 |
WTP for turkey bacon and turkey lunchmeat
Respondents were willing to pay a positive amount for all verifiers and attributes examined for turkey bacon (Table 3-4). Respondents were willing to pay a higher amount for USDA certified free range turkey bacon ($3.47) when compared to USDA certified fed a vegetarian diet ($2.08) and USDA certified antibiotic use not permitted ($2.24) turkey bacon. For retailer certified hormone use not permitted turkey bacon, respondents were willing to pay a higher amount ($3.55) when compared to all other retailer certified attributes. Respondents were willing to pay a lower amount for retailer certified fed a vegetarian diet turkey bacon ($1.49) when compared to retailer certified hormone use not permitted ($3.55) and retailer certified antibiotic use not permitted ($2.47). For industry certified hormone use not permitted, respondents were willing to pay a higher amount ($2.65) when compared to industry certified free range turkey bacon ($1.20). Respondents had a higher WTP for USDA certified free range turkey bacon when compared to all other certifiers. For the attributes fed a vegetarian diet, hormone use not permitted and antibiotic use not permitted there were no statistically significant differences between the certifiers.
Respondents were willing to a pay a statistically significant positive amount for all attributes and verifiers included for turkey lunchmeat with the exception of retailer certified free range and retailer certified fed a vegetarian diet (Table 3-4). The confidence intervals for respondent WTP for retailer certified free range and retailer certified fed a vegetarian diet both included zero, which indicates the WTP for both attributes were not statistically significant. Respondents were willing to pay a statistically significant higher amount ($4.47) for USDA certified free range turkey lunchmeat when compared to USDA certified fed a vegetarian diet ($2.61) and USDA certified antibiotic use not permitted ($2.50). WTP for retailer certified hormone use not permitted ($6.01) was statistically higher than retailer certified antibiotic use not permitted ($4.48).
Respondents were willing to pay a higher amount for industry certified fed a vegetarian diet turkey lunchmeat ($4.17) when compared to industry certified free range ($1.35) and industry certified antibiotic use not permitted ($2.05) turkey lunchmeat. When comparing between the verifiers, respondents were willing to pay a higher amount for USDA certified free range turkey lunchmeat when compared to industry certified free range turkey lunchmeat. Respondents were willing to pay a higher amount for industry certified fed a vegetarian diet turkey lunchmeat when compared to USDA certified fed a vegetarian diet. Recall WTP for retailer certified free range and retailer certified fed a vegetarian diet turkey lunchmeat were not statistically significant. Respondents were willing to pay more for retailer certified hormone use not permitted and retailer certified antibiotic use not permitted when compared to both USDA and industry certification.
Respondents experienced negative utility from walking away from both turkey bacon and turkey lunchmeat purchasing opportunities. Those who purchased turkey experienced higher disutility for each age category and both products when compared to those who did not buy turkey. Additionally, as age increased, the disutility from walking away from a turkey bacon or turkey lunchmeat buying experience decreased for both those who did and did not purchase turkey. Normalizing for the average price presented to respondents for each product ($3.65 for turkey bacon and $5.99 for turkey lunchmeat) the disutility experienced by respondents from walking away from a turkey bacon or lunchmeat purchasing opportunity was statistically compared. The disutility experienced by those who buy turkey and were aged 18-24 and 25-34 was greater for turkey bacon when compared to turkey lunchmeat. Additionally, for all age categories for those who do not buy turkey the disutility of walking away from a turkey bacon buying opportunity was greater than walking away from a turkey lunchmeat buying opportunity.
In addition to differences in disutility (negative WTP) for the two turkey products studied and walking away from a purchasing opportunity, there were statistical differences in WTP between the certifiers and attributes studied. Respondents had a higher WTP (normalized by average price) for retailer certified free range turkey bacon and retailer certified fed a vegetarian diet turkey bacon. This finding is not surprising as both of these certifier attribute combinations spanned zero for turkey lunchmeat. Respondents were willing to pay a higher amount, normalized by average price, for industry certified fed a vegetarian diet turkey lunchmeat when compared to turkey bacon.
| Attributes | Turkey Bacon (n=559) | Turkey Lunchmeat (n=571) | ||
|---|---|---|---|---|
| Coefficient (SE) | Standard Deviation (SE) | Coefficient (SE) | Standard Deviation (SE) | |
| USDA certified free range | 0.692***(0.090) | 0.332***(0.109) | 0.576***(0.081) | 0.932***(0.107) |
| USDA certified fed a vegetarian diet | 0.415***(0.075) | 0.088(0.085) | 0.336***(0.063) | 0.060(0.087) |
| USDA certified hormone use not permitted | 0.591***(0.083) | 0.567***(0.117) | 0.521***(0.073) | 0.039(0.095) |
| USDA certified antibiotic use not permitted | 0.447***(0.079) | 0.186(0.115) | 0.322***(0.077) | 0.967***(0.093) |
| Retailer certified free range | 0.388***(0.086) | 0.279***(0.101) | 0.079(0.076) | 0.002(0.105) |
| Retailer certified fed a vegetarian diet | 0.297***(0.081) | 0.012(0.114) | 0.029(0.080) | 0.358***(0.084) |
| Retailer certified hormone use not permitted | 0.707***(0.086) | 0.069(0.083) | 0.775***(0.084) | 0.175**(0.077) |
| Retailer certified antibiotic use not permitted | 0.493***(0.079) | 0.399***(0.078) | 0.578***(0.076) | 0.084(0.083) |
| Industry certified free range | 0.238**(0.101) | 0.249*(0.136) | 0.175**(0.076) | 0.108(0.100) |
| Industry certified fed a vegetarian diet | 0.396***(0.092) | 0.116(0.098) | 0.537***(0.081) | 0.011(0.086) |
| Industry certified hormone use not permitted | 0.529***(0.090) | 0.085(0.094) | 0.403***(0.084) | 0.118(0.095) |
| Industry certified antibiotic use not permitted | 0.430***(0.086) | 0.145*(0.076) | 0.264***(0.077) | 0.196*(0.077) |
| Opt Out | -6.097***(0.489) | 1.052*(0.213) | -4.384***(0.376) | 3.648***(0.467) |
| Price | -0.399***(0.030) | -0.258***(0.017) | ||
| Buys turkey, age 18-24 | -6.623*** | -6.150*** | ||
| Buys turkey, age 25-34 | -6.112*** | -5.827*** | ||
| Buys turkey, age 35-44 | -5.601*** | -5.503*** | ||
| Buys turkey, age 45-54 | -5.090*** | -5.179*** | ||
| Buys turkey, age 55-64 | -4.579*** | -4.855*** | ||
| Buys turkey, age 65+ | -4.067*** | -4.532*** | ||
| Doesn't buy turkey, age 18-24 | -5.585*** | -4.061*** | ||
| Doesn't buy turkey, age 25-34 | -5.074*** | -3.737*** | ||
| Doesn't buy turkey, age 35-44 | -4.563*** | -3.413*** | ||
| Doesn't buy turkey, age 45-54 | -4.052*** | -3.090*** | ||
| Doesn't buy turkey, age 55-64 | -3.541*** | -2.766*** | ||
| Doesn't buy turkey, age 65+ | -3.029*** | -2.442 | ||
| Attributes | Turkey Bacon (n=559) | Turkey Lunchmeat (n=571) | P value comparing WTP between Bacon and Lunchmeat | ||
|---|---|---|---|---|---|
| Mean WTP | WTP 95% confidence interval | Mean WTP | WTP 95% confidence interval | ||
| USDA certified free range | $3.47 | [$2.98, $4.01] | $4.47 | [$3.76, $5.23] | 0.9831 |
| USDA certified fed a vegetarian diet | $2.08 | [$1.65, $2.58] | $2.61 | [$1.98, $3.24] | 0.9558 |
| USDA certified hormone use not permitted | $2.96 | [$2.48, $3.51] | $4.04 | [$3.34, $4.75] | 0.9373 |
| USDA certified antibiotic use not permitted | $2.24 | [$1.81, $2.71] | $2.50 | [$1.85, $3.14] | 0.9945 |
| Retailer certified free range | $1.94 | [$1.48, $2.42] | $0.61 | [-$0.04, $1.25] | <0.0000 |
| Retailer certified fed a vegetarian diet | $1.49 | [$1.08, $1.91] | $0.23 | [-$0.38, $0.82] | <0.0000 |
| Retailer certified hormone use not permitted | $3.55 | [$3.07, $4.09] | $6.01 | [$5.23, $6.80] | 0.4028 |
| Retailer certified antibiotic use not permitted | $2.47 | [$2.06, $2.91] | $4.48 | [$3.86, $5.17] | 0.2048 |
| Industry certified free range | $1.20 | [$0.71, $1.61] | $1.35 | [$0.75, $1.98] | 0.8967 |
| Industry certified fed a vegetarian diet | $1.99 | [$1.54, $2.47] | $4.17 | [$3.52, $4.92] | 0.0419 |
| Industry certified hormone use not permitted | $2.65 | [$2.21, $3.14] | $3.13 | [$2.50, $3.75] | 0.9937 |
| Industry certified antibiotic use not permitted | $2.16 | [$1.73, $2.65] | 2.05 | [$1.41, $2.72] | 0.9982 |
| Buys turkey, age 18-24 | -$16.61 | [-$17.99, -$15.34] | -$23.87 | [-$25.76, -$22.06] | 0.0077 |
| Buys turkey, age 25-34 | -$15.33 | [-$16.60, -$14.14] | -$22.61 | [-$24.43, -$20.95] | 0.0241 |
| Buys turkey, age 35-44 | -$14.05 | [-$15.19, -$13.00] | -$21.36 | [-$23.09, -$19.82] | 0.0742 |
| Buys turkey, age 45-54 | -$12.77 | [-$13.83, -$11.81] | -$20.10 | [-$21.66, -$18.65] | 0.2099 |
| Buys turkey, age 55-64 | -$11.48 | [-$12.45, -$10.61] | -$18.84 | [-$20.31, -$17.51] | 0.5241 |
| Buys turkey, age 65+ | -$10.20 | [-$11.12, -$9.37] | -$17.59 | [-$18.98, -$16.33] | 0.7861 |
| Doesn't buy turkey, age 18-24 | -$14.01 | [-$15.22, -$12.95] | -$15.76 | [-$17.09, -$14.40] | <0.0000 |
| Doesn't buy turkey, age 25-34 | -$12.73 | [-$13.84, -$11.78] | -$14.50 | [-$15.70, -$13.25] | <0.0000 |
| Doesn't buy turkey, age 35-44 | -$11.45 | [-$12.45, -$10.59] | -$13.25 | [-$14.33, -$12.12] | <0.0000 |
| Doesn't buy turkey, age 45-54 | -$10.16 | [-$11.06, -$9.41] | -$11.99 | [-$13.02, -$10.94] | <0.0000 |
| Doesn't buy turkey, age 55-64 | -$8.88 | [-$9.69, -$8.17] | -$10.73 | [-$11.70, -$9.77] | <0.0000 |
| Doesn't buy turkey, age 65+ | -$7.60 | [-$8.31, -$6.94] | -$9.48 | [-$10.40, -$8.53] | <0.0000 |
Notes: 95% confidence intervals were found using the Krinksy Robb method. A complete combinatorial test was performed on the attribute WTP/average price of each product ($3.65 for turkey bacon and $5.99
Discussion
Eighty-seven percent of respondents indicated they were the primary shopper for their household which is consistent with previous research that has found 88% (Bir et al., 2019) and 86% (Ochs et al., 2019) of respondents in national-scale samples. In an online survey of U.S. respondents, Lee and Yun (2015) found that 51% of respondents indicated they did all of the shopping in the household, while 41% of respondents indicated they did most of it. Higher percentages of respondents purchased organic fruits, vegetables, chicken and beef which ranged from 30-35%. Lee and Yun (2015) similarly found that over 40% of respondents purchased a wide category of organic foods. While not yet entirely mainstream as a grocery shopping statistic, increased attention has been devoted to spending and use of online food shopping in recent years. Even 20 years ago, Morganosky and Crude (2000) identified reasons for online food shopping and found that 19% of their sample of 243 US consumers who participated in online grocery shopping bought all of their groceries online. Participation in Amazon Prime was collected as a statistic potentially indicative of propensity to shop online. Particularly interesting, given the focus of this study on food items was the approximately 40% of respondents who had used Amazon Prime Pantry and approximately the same proportion who had employed other online grocery shopping providers. On average, respondents spent $127 per week on total food, which was similar to the finding by McKendree et al. (2013) of an average weekly expenditure of $132.77.
Many of the livestock rearing or production related claims are credence attributes of livestock-derived food products, including claims about housing, management practices, and even dietary restrictions for the animals. Because consumers cannot discern claims about credence attributes even after the product is purchased and consumed (Caswell & Mojduszka, 1996), such as housing types for turkeys while they were alive, the consumer must rely on labeling or certification entities to convince them the claims are indeed true. A multitude of studies have been completed in agricultural economics literature studying credence attributes of meat products. Norwood and Lusk (2011) offered an economist-framed approach to navigating questions to inform livestock producer (as well as policy maker) decision making via a number of summarized and interpreted consumer demand experiments. Cicia and Colantuoni (2010) documented 23 studies that report 88 WTP valuations for traceable meat attributes. Many studies employ national-scale samples to understand consumer WTP for livestock product attributes such as country-of-origin labeling (Lim et al., 2013) and rearing practices (McKendree et al., 2013; Lusk, 2018). Byrd, Widmar, & Gramig (2018b) studied the relative ranking of six meat attributes and found differences in rank order depending on the experimental design studied; but, the top three attributes were robust across designs with safety ranking first, taste ranking second, animal welfare ranking third, and price ranking third or fourth. While the relative ranking is informative on the whole, the implications are for meat defined broadly. Certainly food safety should be a main point of concern for consumers cooking raw meats, and especially poultry products. But, are processed products, and in particular those products that are not generally cooked before consumption – like lunchmeats – fundamentally different?
While studies continue to attempt to identify effective ways to improve consumer home food safety/handling (Maughan, Chambers, and Godwin, 2016), lunchmeat remains an outlier from the common meat handling and preparation guidelines. Consider lunchmeat in contrast to other poultry products for which marketing campaigns have been developed to educate consumers about safe handling and cooking to a specified temperature before consuming. Admittedly, there are segments of the population for whom heating of lunchmeats until steaming hot is recommended. Listeria from lunchmeat is most likely to sicken pregnant women and their newborns, adults aged 65 or older, and people with weakened immune systems (CDC, 2019); thus the United States Food and Drug Administration recommends pregnant women reheat lunchmeats to steaming hot before consumption (FDA, 2018). Still, the United States Center for Disease Control and Prevention outlines lunchmeats as one of the potential sources of Listeria infections, although notably since the 1990s outbreaks linked to dairy and produce have also occurred (CDC, 2019).
McKendree and Widmar (2013) identified lunchmeat eating occasions which mirrored common perceptions associated with the nomenclature, ‘lunch’meat. In total 76% of households studied consumed lunchmeat on a sandwich, whereas far fewer respondents indicated occasions such as eaten alone (10%), on a salad (6%) or as a snack (7%) (McKendree & Widmar, 2013). This analysis made advancements in understanding when, as in the time of the year, lunchmeat purchases were made. Turkey lunchmeat had a notable spike in the Fall season, hypothesized to correspond with back-to-school season and associated packed lunches. It has been repeatedly found that turkey is either the most, or among the most, popular lunchmeat options for U.S. consumers as a whole (Mintel, 2012; McKendree & Widmar, 2013). Mintel (2012) documented that turkey was consumed in 94% of lunchmeat-purchasing households, with ham coming in a very close second in 92% of households. McKendree and Widmar (2013) documented turkey as the first ‘most often purchased lunchmeat’ as well as the second ‘second most often purchased lunchmeat’, again with ham lunchmeat at the corresponding second most popular. One of the more interesting findings perhaps is the stated popularity of chicken lunchmeat. Mintel (2012) documented chicken as being consumed in 83% of lunchmeat-consuming households. McKendree and Widmar (2013) only asked about first and second most often purchased variety, but still identified chicken for 8% of households as first most often and 13% of households as second most often. Chicken lunchmeat offers an interesting point of comparison given the focus in this analysis on turkey products, as they are both processed poultry products.
A higher estimated disutility associated with opting out of purchasing turkey lunchmeat for younger respondents was identified in this study, which aligns with the general notion that younger consumers more often purchase/consume lunchmeat. McKendree and Widmar (2013) identified that households that consumed lunchmeat were more often larger, more often had children as household members, and had higher mean household food expenditures than households that did not consume lunchmeat. Furthermore, households purchasing greater than 1.1 lbs of lunchmeat weekly were even younger and larger in terms of number of household members (including children).
Relatively few consumer demand studies have been dedicated specifically to poultry products. Recent additions to the literature focusing on poultry products include Van Loo et al. (2011) which sought to estimate consumer WTP for organic chicken breasts and Byrd, Widmar and Wilcox (2018a) who found positive WTP for local, antibiotic-free and pasture based production of chicken breasts. Bett et al. (2013) investigated consumer WTP for indigenous chicken products in three regions of Kenya, while Mulder and Zomer (2017) specifically studied Dutch consumers’ willingness to pay for broiler welfare attributes. Notably, Saitone, Sexton, and Sumner (2015) state that the overall economic benefits of implementing restrictions on livestock production industries (specifically referencing pork) strongly depend on the demand response by consumers. Seeking to understand consumer demand for broiler rearing attributes, Mulder and Zomer (2017) found that outdoor access and anesthesia before slaughter were particularly valued. Specific to turkey, Widmar et al. (2016) measured consumer preferences for six holiday turkey attributes, including weight, price, antibiotic free, local, pasture access, and brand.
Olynk, Tonsor, and Wolf (2010) found evidence of varying WTP for verified production process attributes depending on the product (milk versus pork chops), and thus species, involved. In addition, they found that the valuation of specific production process attributes varied, as did the value placed on verification of those attributes (Olynk et al., 2010). Building on the finding which suggested differences in preferences for attributes across products from varying livestock species, additional studies sought to investigate evidence of variation in WTP across different products from the same livestock species. Olynk and Ortega (2013) identified differences in consumer valuation (relative to the product price levels) for verified production process attributes for dairy cows depending on whether consumers were buying yogurt or ice cream with the same production attributes. In contrast, Mckendree et al. (2013) found no differences, relative to product price levels, when comparing verified attributes across smoked ham and ham lunchmeat products. Multiple potential explanations may be proposed, including whether the differentiation in species, pig versus dairy cow, or in product type, meat versus dairy, are responsible for the difference in findings. Alternatively, the individual products themselves may be responsible for the deviation, with the pork products being both processed similarly and more closely related than yogurt and lunchmeat.
In the case of turkey bacon versus turkey lunchmeat, both are processed products, although they are potentially differentiated in their use or consumption occasions. The consumption occasion differences as well as preparation time may contribute to the differences in WTP for some attributes in this study, as well as the differences in disutility experienced from walking away from a buying opportunity. Respondents experienced greater disutility from walking away from a turkey bacon buying experience, which may be influenced by the overall popularity and enthusiasm people have for bacon.
Conclusions and Implications
Consumer WTP for turkey bacon was assessed using a sub-sample of 559 randomly assigned respondents, while the remaining 571 respondents participated in a choice experiment employed to estimate WTP for turkey lunchmeat attributes. In total, 95% of respondents consumed poultry, and 40% indicated they consumed it 2 – 3 time per week. Given the focus on processed turkey products, nitrite and nitrate were actively focused on within the survey. Thirty-four percent of respondents indicated that they actively avoided products with nitrite and nitrates. Forty-eight percent of respondents indicated that they eat lunch outside the home once or twice a week.
The mean estimated WTP was positive for all verified attributes of turkey bacon. Respondents were willing to a pay a statistically significant positive amount for all attributes and verifiers included for turkey lunchmeat with the exception of retailer certified free range and retailer certified fed a vegetarian diet. For all age categories, the disutility of walking away from a turkey bacon buying opportunity was greater than walking away from a turkey lunchmeat buying opportunity. There were statistical differences in WTP between the certifiers and attributes studied between the two processed turkey products. Namely, respondents had a higher WTP (normalized by average price) for retailer certified free range turkey bacon and retailer certified fed a vegetarian diet turkey bacon than lunch meat with either of these attributes. Respondents were WTP a higher amount for industry certified fed a vegetarian diet turkey lunchmeat when compared to turkey bacon. Given the interest in processed poultry products, and popularity of turkey products overall, these findings suggest that demand for these attributes varies across turkey products, even when both products are processed and seemingly similar in their consumption occasions.
References
- Bett, H.K., K.J. Peters, U.M. Nwankwo, and W. Bokelmann. 2013. Estimating consumer preferences and willingness to pay for the underutilized indigenous chicken products. Food Policy. 41: 218-225.
- Bir, C., A.M. Cummins, N.O. Widmar, and C.A. Wolf. 2018. Willingness to Pay Estimates Informing
Agribusiness Decision Making: A Cautionary Tale. Int. Food Agribus. Man. 21(7): 865-882. - Bir, C., J. Lai, N.O. Widmar, N.M. Thompson, J. Ellett, and C. Crosslin. 2019. “There’s no place like home”:
Inquiry into preferences for local foods. J. Food Distrib. Res. 50(1): 29-45. - Byrd, E., N.J.O. Widmar, and M. Wilcox. 2018a. Are consumers willing to pay for local chicken breasts
and pork chops? J. Food Prod. Mark. 24: 235-248. - Byrd, E., N.J.O. Widmar, and B.M. Gramig. 2018b. Presentation matters: Number of attributes presented impacts estimated preferences. Agribus. Int. J. 34(2): 377-389.
- Caswell, J.A., and E.M. Mojduszka. 1996. Using informational labeling to influence the market for quality in food products. Am. J. Agric. Econ. 78(5): 1248-1253.
- Caswell, J.A. 1998. How labeling of safety and process attributes affects markets for food. Agric. Res.
Econ. Rev. 27(2): 151-158. - Cicia, G. and F. Colantuoni. 2010. Willingness to pay for traceable meat attributes: A meta-analysis.
International J. on Food System Dynamics. 3: 252-263. - Daniels, J. 2016. More Americans are passing on old-fashioned bacon, red meat to chow down on turkey. Accessed May. 2019. https://www.cnbc.com/2016/10/03/more-americans-are-passing-on-bacon-red-meat-to-chow-down-on-turkey.html
- Fleming, C. M. and M. Bowden. 2009. Web-based surveys as an alternative to traditional main methods.
J. Environ. Manage. 90: 284-292. - Galesic, M., and M. Bosnjak. 2009. Effects of questionnaire length on participation and indicators of
response quality in a web survey. Public Opin. Q. 73(2): 349-360. - Hackett Robert. 2015. Why Bacon is suddenly everywhere. Fortune. Accessed May 2019.
http://fortune.com/2015/05/19/bacon/. - Hudson, D., L. Seah, D. Hite, and T. Haab. 2004. Telephone presurveys, self-selection, and non-response
bias to mail and internet surveys in economic research. Appl. Econ. Lett. 11: 237–240. - Jones, K., M. Haley, and A. Melton. 2018. Per capita red meat and poultry disappearance: Insights into its steady growth. United States Department of Agriculture (USDA) Economic Research Service. Statistic: Animal products. Accessed Sep. 2019. https://www.ers.usda.gov/amber-waves/2018/june/per-capita-red-meat-and-poultry-disappearance-insights-into-its-steady-growth/.
- Julson, E. 2018. Is turkey Bacon Healthy? Nutrition Calories and More. Healthline. Accessed Oct. 2019.
https://www.healthline.com/nutrition/turkey-bacon. - Krinsky, I., and A.L. Robb. 1986. On approximating the statistical properties of elasticities. Rev. Econ.
Stat. 68(4): 715-719. - Lee, H.J., and Z.S Yun. 2015. Consumers’ perceptions of organic food attributes and cognitive and
affective attitudes as determinants of their purchase intentions toward organic food. Food Qual. Prefer. 39: 259-267. - Lim, K.H., W. Hu, L.J. Maynard, and E. Goddard. 2013. US consumers’ preference and willingness to pay for country-of-origin-labeled beef steak and food safety enhancements. Can. J. Agr. Econ. 61(1): 93-118.
- Louviere, J.J., T. Islam, N. Wasi, D. Street, and L. Burgess. 2008. Designing discrete
choice experiments: do optimal designs come at a price? J. Consum. Res. 35: 360–375. - Lusk, J.L. 2003. Effects of cheap talk on consumer willingness-to-pay for golden rice. Am. J. Agric. Econ. 85(4): 840-856.
- Lusk, J.L. 2018. Consumer preferences for cage-free eggs and impacts of retailer pledges. Agribus. Int. J.
35(2): 129-148. - Lusk, J.L., and F.B. Norwood. 2005. Effect of experimental design on choice-based conjoint valuation
estimates. Am. J. Agric. Econ. 87(3): 771–785. - Maughan, C., I.E. Chambers, and S. Godwin. 2016. Food safety behaviors observed in celebrity chefs
across a variety of programs. J. Public Health. 39(1): 105-112. - Marta-Pedroso, C., H. Freitas, and T. Domingos. 2007. Testing for the survey mode effect on contingent
valuation data quality: A case study of web-based versus in-person interviews. Ecol. Econ. 62: 388–398. - McKendree, M., and N.O. Widmar. 2013. Consumer perceptions of livestock products and animal welfare. Center for Food and Agricultural Business Research paper. CAB RP 13.1. Accessed Oct. 2019. https://agribusiness.purdue.edu/files/resources/r-7-2013-mckendree-olynk-widmar.pdf
- McKendree, M., N.O. Widmar, D.L. Ortega, and K.A. Foster. 2013. Consumer preferences for verified
pork-rearing practices in the production of ham products. J. Agric. Resource Econ. 38(3): 397-417. - Mintel Group Ltd. 2012. Report: Lunch Meat-US-May 2012. Accessed Jun. 2019.
http://academic.mintel.com/display/590558/?highlight=true. - Morgan, C.J., N.J.O. Widmar, M.D. Wilcox, and C.C. Croney. 2018 Perceptions of Agriculture and Food
Corporate Social Responsibility. J. Food Prod. Mark. 24(2): 146-162. - Morganosky, M.A., and B.J. Cude. 2000. Consumer response to online grocery shopping. Int. J. Retail
Dist. Manage. 28(1): 17-26. - Mulder, M., and S. Zomer. 2017. Dutch Consumers’ Willingness to Pay for Broiler Welfare, J. Appl. Anim.
Welf. Sci. 20(2): 137-154. - Norwood, F.B., and J.L. Lusk. 2011. Compassion, by the Pound: The Economics of Farm Animal Welfare. Oxford University Press, NY, NY.
- Ochs, D., C. Wolf, N.O. Widmar, C. Bir. 2019. Is there a “cage-free” lunch in US egg production? Public
views of laying hen housing attributes. J. Agr. Resour. Econ. 44(2): 345-361. - Olynk, N.J., and D.L. Ortega. 2013. Consumer preferences for verified dairy cattle management practices
in processed dairy products. Food Control. 30(1): 298-305. - Olynk, N.J., G.T. Tonsor, and C.A Wolf. 2010. Consumer willingness to pay for livestock credence
attribute claim verification. J. Agr. Resour. Econ. 35(2): 261-280. - Plain. 2017. Record bacon prices driving retail pork prices. National hog farmer. Accessed October 2019.
https://www.nationalhogfarmer.com/marketing/record-bacon-prices-driving-retail-pork-prices. - Poe, G.L., K.L. Giraud, and J.B. Loomis. 2005. Computational methods for measuring the difference of
empirical distributions. Am. J. Agric. Econ. 87(2): 353-365. - Saitone, T. L., R. J. Sexton, and D.A. Sumner. 2015. What happens when food marketers require
restrictive farming practices? Am. J. Agric. Econ. 97: 1021–1043. - Schenker, N., and J.F. Gentleman. 2001. On judging Significance of Difference by Examining the Overlap
Between Confidence Intervals. Am. Stat. 53: 182-186. - Shannon, K. 2018. Tasting Turkey Bacon. Cook’s Illustrated. Accessed Sep. 2019.
https://www.cooksillustrated.com/articles/625-tasting-turkey-bacon - Tonsor, G.T., and C.A. Wolf. 2010. Drivers of resident support for animal care oriented ballot initiatives.
J. Agric. Appl. Econ. 42(3): 419-428. - Train, K.E. 2009. Discrete choice methods with simulation. Cambridge university press, NY, NY.
- United States Center for Disease Control and Prevention (CDC) (2019). Content source: Centers for Disease Control and Prevention, National Center for Emerging and Zoonotic Infectious Diseases (NCEZID), Division of Foodborne, Waterborne, and Environmental Diseases (DFWED). Accessed Apr. 2019. https://www.cdc.gov/listeria/prevention.html
- U.S. Census Bureau. 2016. Annual Estimates of the Resident Population for the United States, Regions, States, and Puerto Rico: April 1, 2010 to July 1, 2015 (NST-EST2015-01).” Source: U.S. Census Bureau, Population Division. Release Date: June 2016.
- United States Department of Agriculture (USDA), Economic Research Service (ERS). April 26, 2019 creation of historic dataset “Meat production, imports, total supply, exports, total and per capital disappearance with history.” Accessed Oct. 2019. http://www.ers.usda.gov/data-products/livestock-meat-domestic-data.aspx.
- United States Food and Drug (FDA) Administration. 2018. Listeria from Food Safety for Moms to Be.
Accessed Apr. 2019. https://www.fda.gov/food/health-educators/listeria-food-safety-moms-be - Van Loo, E. J., V. Caputo, R.M. Nayga, J. Meullenet, and S.C. Ricke. 2011. Consumers’ willingness to pay
for organic chicken breast: Evidence from choice experiment. Food Qual. Prefer. 22: 603-613. Widmar, - Widmar, N.J.O., E. Byrd, C.A. Wolf, and L. Acharya. 2016. Health Consciousness and Consumer Preferences for Holiday Turkey Attributes. J. Food Distrib. Res. 47(2): 83-97.